The Company's PC Data Analysis process
Imagine that your boss think that you are ready to solve a problem for a new client, and you answer him with: "Yes! of course"
The client is a Finance company, to work they use very much computers, every different from each other. They want all computers of the same appearance and characteristics to improve their compatibility
You need to be careful selecting the computer, should be cheap, with enough resources, and preferently easy to give it maintainment
You are free to choose the data from you need, and your audience will be various teams in our and their company
My role
- Project management
- Research for data
- Cleaning & documenting the process
- Analyze data
- Make visualizations presentation to workmates
Asking
At this part there is some questions principally for myself, to determine more exactly "What will I analyze?", but inside data analysts teams this phase could change a lot
-
What themes am I exploring?
Computers, their sales, advantages and characteristics
-
What is the problem I am trying to solve?
Discover what PC will offer more possibilities, can be laptops or desktops, buy separated components or all in one packages
-
Which metrics I will use to measure the data in order to achieve the
goal?
Number of sales, prices and PC reviews
-
Who are my stakeholder?
A big variety of workers with distinct tasks and objectives inside out company and the company client
-
What is my audience?
Probably people of all types, origins, ages and studies
-
How can help my knowledges to the client to take decisions?
For me is a easy theme to understand and have seen that use all in one laptops are recommended
Prepare the environment
This phase is to think a few more specificly about the data, and collecting it keeping in mind the bias
Then the type of data I am looking for is a little unexplored but there are this four datasets in Kaggle that help me a lot. Keep in mind, this datasets could have some bias because the creators didn't add so much metadata
-
Laptop league: Data from the Zenodo store
Original Kaggle dataset -
AmazonPC: Data from the Amazon store
Original Kaggle dataset -
PC component price comparison: Data from different pages and stores through the web
Original Kaggle dataset -
Curry World laptop: Data obtained from a store called Curry and the creator created it using Selenium and Python
Original Kaggle dataset
The next step was put all this in a directory system, naming each file and folder with a standardized format like name_day_month_year_v01
All this are in Kaggle, they has Creative Commons (CCO) Domain Public License, for that reason there isn't need to give credits to the authors, but you can give they a point up in Kaggle
Process and cleaning data
As programmer I was able to choice languages like Python or R but I thought in choose Microsoft Excel to do this project because the four datasets has the .CSV format and this tool is the most efficient with these small datasets.
The integrity of the files is I expected, the most of registers inside each dataset are not clean, this is to say with NULLs and blanks or the text is not enough coherent
Therefore it's necessary use this phase to clean the data because there are errors inside the dataset. This is achieved with techniques like
- Filters to delete speedly the rows with blank cells
- Formatting data types to convert text to numbers
- Formulas like =LEFT( , ) to substract the numbers from ratings cells
- Find & Replacing to remove extra characters
- Column renaming because the tables was different types of names and the standard is all lowercase separated by underscores
Analyze phase
I worked individually the four dataset because they have not enough compatibility between columns being the only two common were the price and rating. Then I ordered descently by price in all
Dataset 1
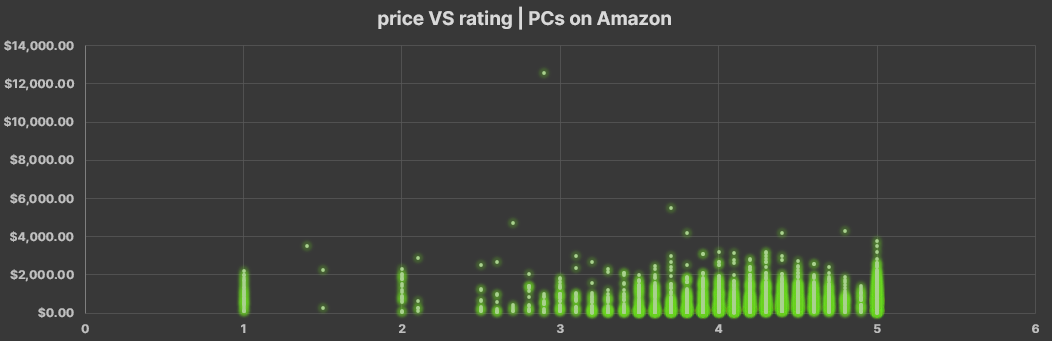
This is the AmazonPC dataset and first I realize that some rows are accesories, delete all the accessories in the column name. Here not seems like there's a tendency between price and rating
Dataset 2
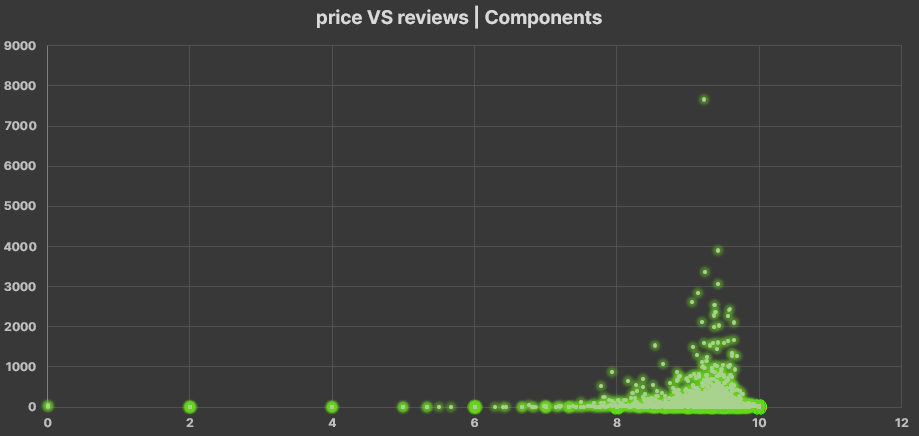
- This is the Components dataset and here there are categories, I would like me to divide the dataset in categories but they are eight
- Only filter categories one by one copying the 10 cheapest to another sheet making a table with eighty rows. Inside that new sheet sum the most cheapest components of all and the result is $ 114.88, not bad
- Afterly I used functions as =IF( , ) and =AVERAGE( ) to calculate the price average of each category, the result is: one common PC costs $1415.8 maybe ten times the cheapest
- Then I make one visualization with the component price and component rating column
Dataset 3
- This is the Curry dataset where the data is almost completely clean and just now is visible that the best prices are in the Lenovo Pads
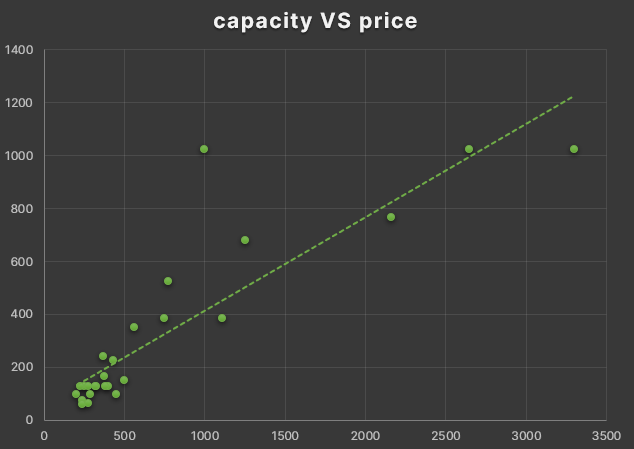
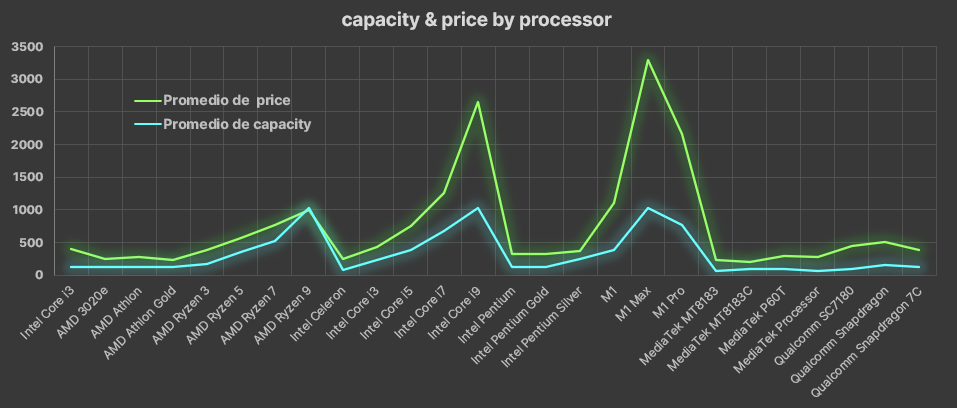
- Here something strange happen, the visualizations had too many horizontal values as if there was more dimentions in the data. I solved this making before Pivot tables in a new sheet, a pivot table for processor capacities and laptop sizes also for prices
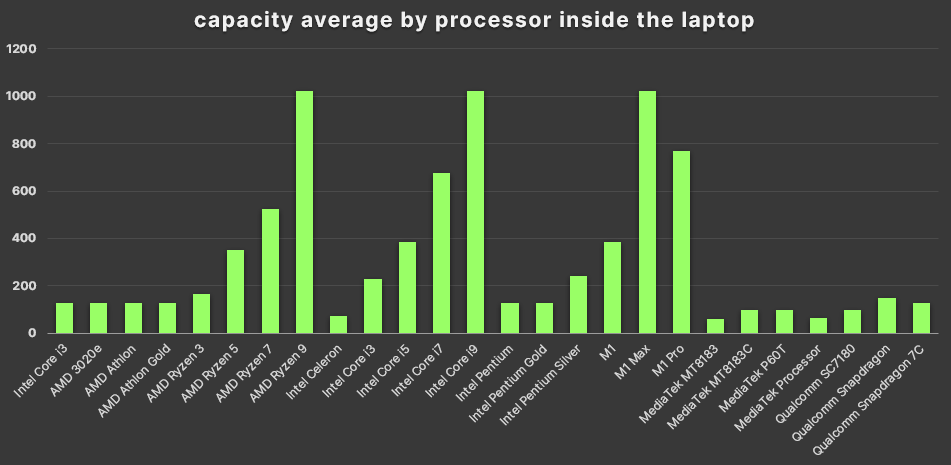
- I notice that laptop sizes often are similar whatever the processor capacity, while the processor price and capacity has a tendency or relation, I mean more price could be more laptop capacity
Dataset 4
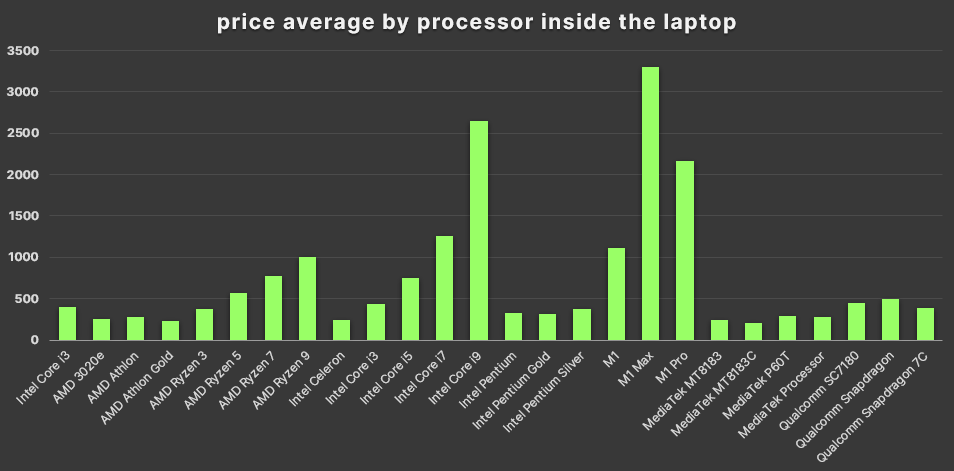
- This is the Laptop League dataset and delete the word "Processor: " in the cell's column processor, seems like the primebook are the most economic option
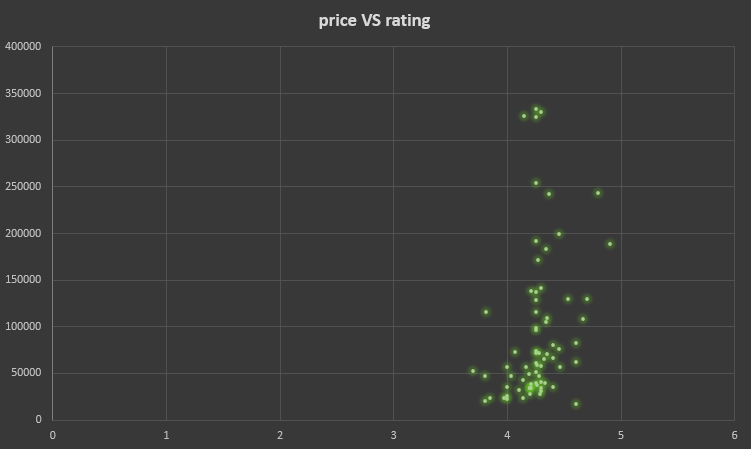
- I create a visualization between the price and the rating column
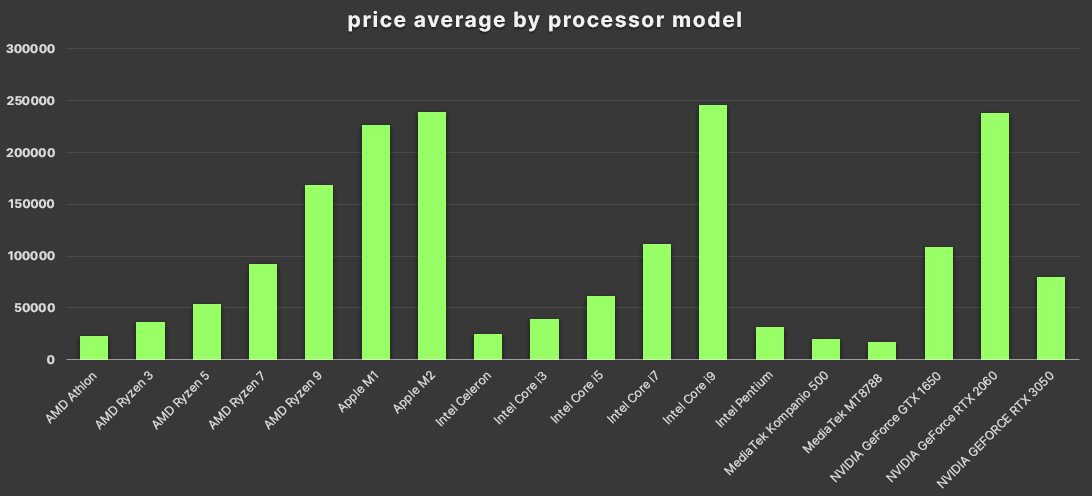
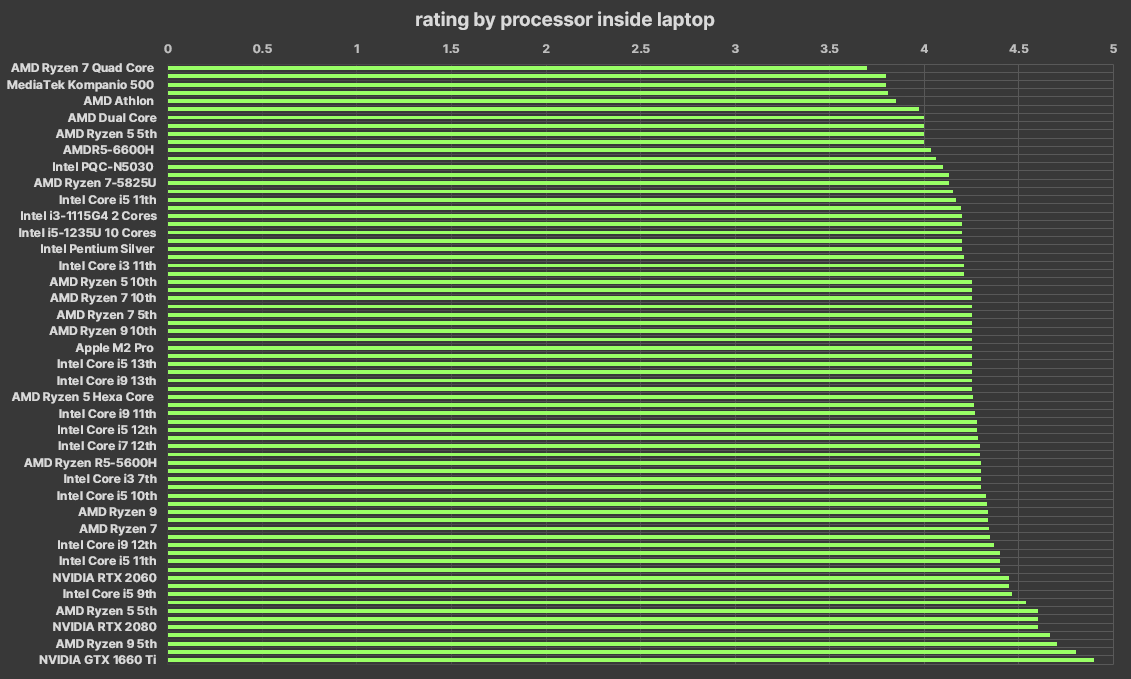
- Here i will compare again processor and prices to confirm the tendency but there is an issue, in the data there are different generations for each processor model and I guess that this is not necessary in this project
- Again use a pivot table and then i collapse various generation models to only one model manually
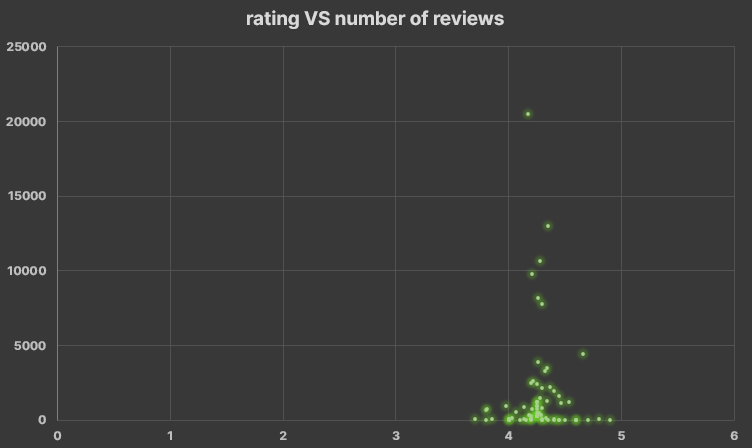
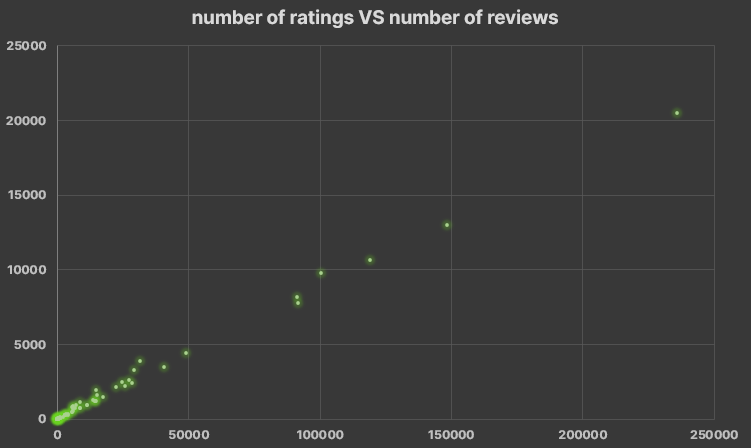
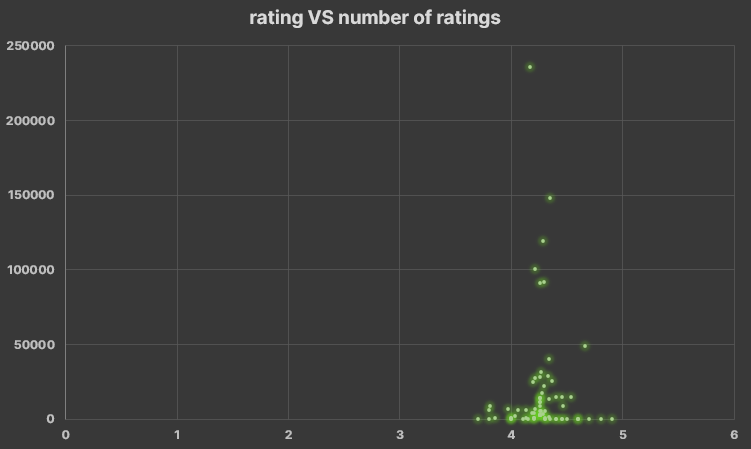
- Then I make three different pivot tables to compare: rating VS number_of_rating, rating VS number_of_reviews and so on. now it's not necessary to collapse the processor generations
- To finish i make the expected price and rating visualization where the result was awesome for me
Until now are here some new answers to the questions in the asking phase. The themes that I am exploring are PC hardware which include peripherals that were removed. Also, I know how coexist different CPUs in the market, what are more similar and compatibles
Now we have an insight from each individual dataset, is a good idea do a review about all this information before to share all with others
Share the results
Conclutions
- There is not tendency between the PC quality and its price (according to AmazonPC, Components and Laptop League datasets)
- The PC's price is approximated to its processor capacity, altought you can find very good options at low cost (according to Curry dataset)
- There is not relation between processor capacity or the Laptop size and the processor capacity (according to Curry and Laptop League datasets)
Take action
This is the last phase in the data analysis process where the insights and conclutions move to the real world. All was done to make logical changes that represent an improvement in the company. As this is a personal project
Soon, to achieve a deeper and further data analysis I recomend to continue with:
- Looking for patterns between PC brands or components and their quality
- Put more details about the data origin and try to find some type of bias within
What I learned
I almost had not knowledges about the Data analysis field that is so widely mentioned in different contexts, as programmer think that this is a job oportunity because is a few similar in the structured thinking and in the tools to carry out the process
I liked the data analysis process and enjoyed make this project